








TL;DR
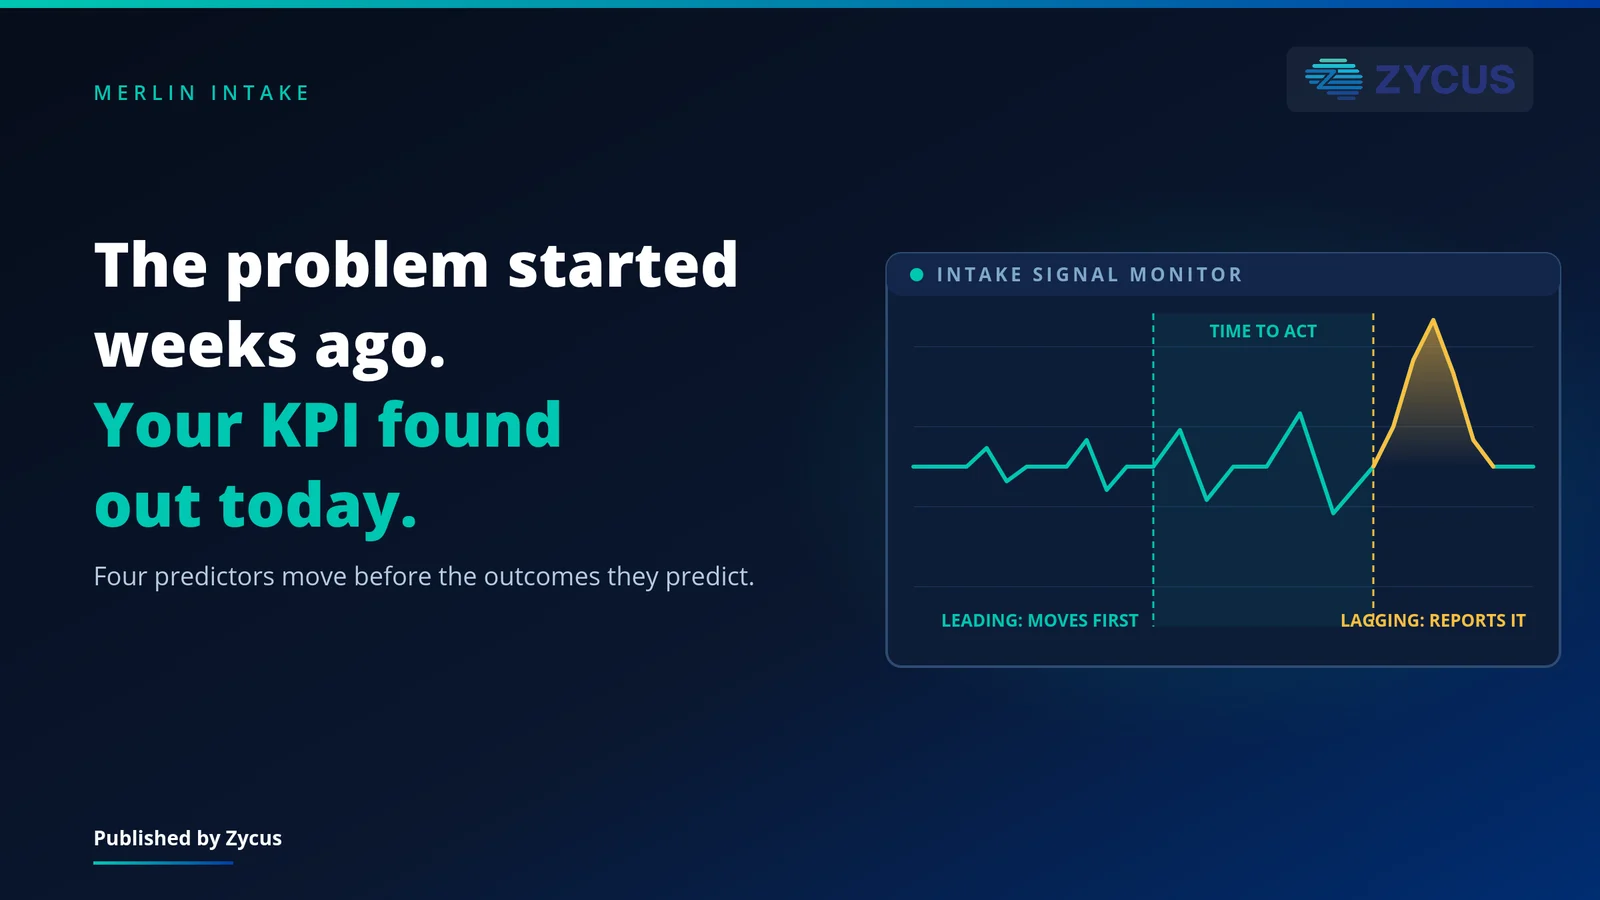
- A lagging intake KPIs and metric reports on a closed period. A leading one gives you time to act.
- Four outcomes matter: cycle time, spend under management, exception rate, and requester satisfaction.
- Four predictors move first: first-pass completeness, off-channel request volume, category match rate, and time to first response.
- Pair each outcome with its predictor, review leading weekly and lagging monthly, and stop at four pairs.
- See how Merlin Intake captures request attributes at submission. Request a demo.
A lagging intake metric tells you what happened. A leading one tells you what is about to. Most intake scorecards are built entirely from the first kind, which is why problems are discovered a quarter after they started.
Cycle time, spend under management, and exception rate are all real measures and all of them report on a period that has closed. By the time cycle time rises, the cause has been operating for weeks. The useful question is not which metrics to track but which ones move first. Most intake scorecards answer the first well and the second not at all.
This is written for procurement operations leaders building or revising an intake scorecard, with a live rollout or an established program to measure. It sits inside a wider S2P KPI framework rather than replacing one.
What separates a leading from a lagging intake metric?
Position in the causal chain, not the metric itself. The same measure can be leading in one scorecard and lagging in another, depending on what sits behind it.
A lagging metric measures an outcome the organization cares about directly. A leading metric measures something that causes that outcome and moves earlier. The pairing is what makes either useful: a leading metric with no lagging metric behind it is trivia, and a lagging metric with no leading metric in front of it is a surprise generator.
The practical test is whether a change in the metric gives you time to act before the outcome changes. If it does not, it is lagging regardless of how sophisticated it is. Sophistication and timeliness are unrelated properties.
One caution. A leading metric is a prediction, not a guarantee. It earns its place by being right often enough to be worth acting on, which is a claim you should verify against your own data rather than assume.
Download A Free Whitepaper – Unlocking Deep Value in Intake Management with Merlin Intake
Which lagging metrics does everyone already track?
Four, and they are the right outcomes to care about. The problem is not the selection. It is that a scorecard made only of these leaves nothing to steer with between reporting periods.
- Request-to-approval cycle time. The headline number, and the one stakeholders judge the function by.
- Spend under management. The proportion of enterprise spend flowing through controlled channels.
- Exception rate. Requests requiring manual intervention, and invoice or receipt mismatches traceable to intake.
- Requester satisfaction. Usually measured periodically, which makes it the slowest signal of all.
None of these is wrong. All of them report on something already finished. A scorecard built only from these tells you accurately how last quarter went. It is a report rather than an instrument, and it cannot be steered by.
Listen to this podcast – Request Management in Procurement is Dead—Intake Management is Here!
Which leading metrics predict them?
Four, each paired to an outcome above, as Figure 1 sets out. Each is a property of the request at the moment it arrives, which is what makes it observable before anything downstream has happened.
- First-pass completeness rate predicts cycle time. The proportion of requests arriving with every required field populated, needing no return trip. When completeness falls, cycle time rises a few weeks later, because rework is the mechanism connecting them. A drop in completeness usually traces to a specific category or a recent form change, which makes it actionable rather than merely alarming.
- Off-channel request volume predicts spend under management. Requests still arriving by email or chat after launch. This one is uncomfortable because it requires counting things that bypassed your system, which most teams stop doing once a platform is live. It falls first when adoption is failing, and it is the only metric here that measures something happening outside the system you just bought.
- Category match rate predicts exception rate. The proportion of requests matching a known category without manual assignment. Unmatched requests become free-text lines, free-text lines become downstream exceptions, and by then the connection to a category gap months earlier is invisible.
- Time to first response predicts requester satisfaction. How long before a requester learns anything at all about their request. It predicts satisfaction better than total cycle time does, because perceived responsiveness tracks acknowledgment rather than completion. A slow request that communicates is tolerated. A fast one that goes silent is not.
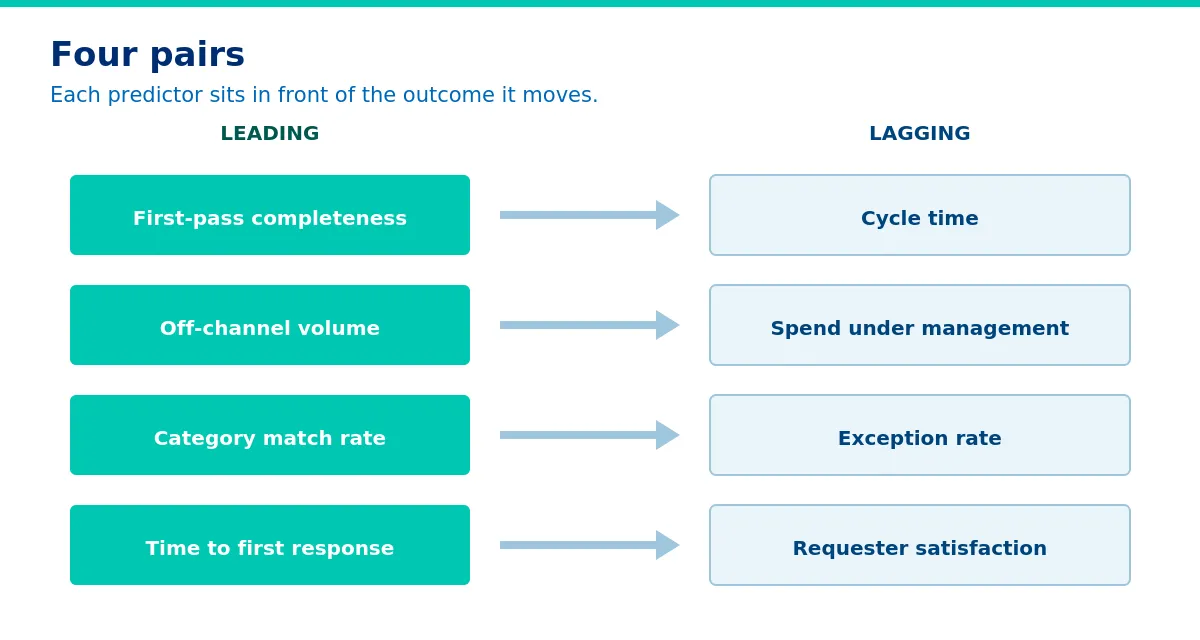
Figure 1: Each predictor sits in front of the outcome it moves.
Download A Free Whitepaper – Transforming Procurement Efficiency with Built-In Intake Management
How far ahead does each one move?
Enough to act, and the intervals differ, which matters for how often you look. Figure 2 places them. A metric reviewed less often than it moves is a metric you are not really using.
First-pass completeness moves earliest and fastest, and it responds within days to a form change or a category addition. Watch it weekly. It is also the only one of the four you can influence directly through a change you control entirely, which makes it the sensible place to start.
Off-channel volume moves over weeks and it moves in one direction unless something is done. It is the most reliable early signal of an adoption problem and the most commonly ignored, because measuring it means admitting the platform is not capturing everything and nobody wants that number in a steering pack.
Category match rate moves as your spend mix changes, usually across a quarter, and it degrades quietly. New categories enter through the business rather than through procurement, so the first sign is a rise in unmatched requests rather than an announcement.
Time to first response moves immediately with routing changes and is the fastest to fix.
The pattern worth noticing is that the leading metrics are all properties of what arrives at the front door, and the lagging ones are all properties of what happens afterward. That is not a coincidence. It is the reason intake is worth measuring separately from procure-to-pay, and the reason a combined scorecard cannot tell you whether a problem started at capture or in execution.
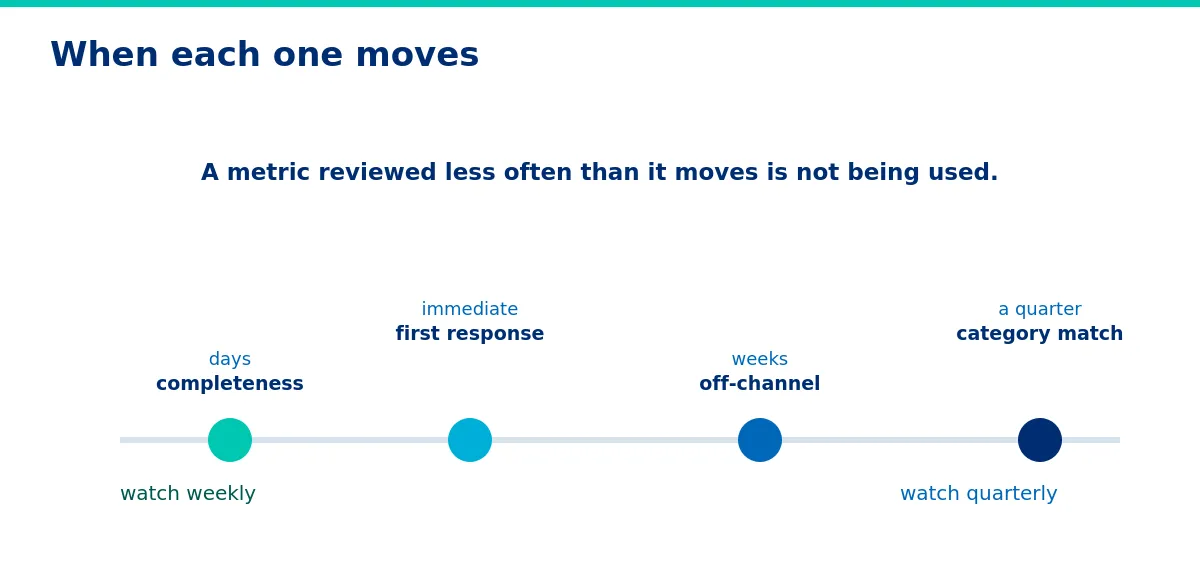
Figure 2: When each metric moves, and how often to look.
Wharton was measuring how enterprises evaluate generative AI investment, not intake programs. What it establishes for this piece is that structured measurement has become the norm rather than the exception, which raises the cost of a scorecard that reports accurately on a closed period and predicts nothing.
Read More Ardent Partners’ Procurement Metrics That Matter in 2026
How do you assemble the scorecard?
In pairs, with the leading metric next to the outcome it predicts, and with a stated lag between them. Writing the expected lag down converts the pairing from an assertion into something testable.
Four pairs is enough for most organizations. Adding more measures does not improve the picture, and every metric added is one somebody eventually games. Four pairs also fits on one page, which determines whether anyone actually reads it. Reviewing weekly on the leading side and monthly on the lagging side matches the cadence at which each actually moves.
Merlin Intake captures the request attributes these measures depend on at the point of submission, so first-pass completeness and category match rate are properties of the record rather than a reporting exercise assembled afterward. Whichever platform you run, the constraint is the same: a metric you cannot capture at intake is a metric you will estimate.
Then hold the pairs long enough to test whether the leading metric actually predicts the lagging one in your environment. If after two quarters it does not, replace it. A predictor that has stopped predicting is worse than none, because it produces confident inaction.

Frequently asked questions
Q1. What are the most important intake management KPIs?
Request-to-approval cycle time, spend under management, exception rate, and requester satisfaction are the outcomes worth caring about. First-pass completeness rate, off-channel request volume, category match rate, and time to first response are the leading indicators that predict them. A useful scorecard pairs each outcome with its predictor.
Q2. What is the difference between a leading and lagging indicator in procurement?
A lagging indicator measures an outcome after it has occurred, such as cycle time for a completed period. A leading indicator measures something that causes that outcome and changes earlier, giving time to intervene. Neither is useful alone: a leading indicator without an outcome behind it is noise, and a lagging one without a predictor in front is a surprise.
Q3. How do you measure intake first-pass completeness?
Count the proportion of submitted requests that contain every required field and need no return trip for missing information. Define required fields per category rather than globally, since a software request and a facilities request need different information. Measure weekly, since it responds quickly to form and category changes.
Q4. How do you measure off-channel requests after intake goes live?
Sample rather than attempt full capture. Ask a defined group to log requests reaching them outside the platform for a fixed period each month, or audit a sample of purchase orders for whether an intake record exists upstream. Full measurement is impossible by definition, which is why most teams stop measuring it entirely and lose the signal.
Q5. How often should intake KPIs be reviewed?
Leading indicators weekly, lagging outcomes monthly. The cadence should match the rate at which each metric actually moves. Reviewing lagging metrics weekly produces noise and reviewing leading metrics monthly wastes the warning they exist to provide.
Q6. What is a good request-to-approval cycle time?
It depends on category, value, and how many approvals apply, so an external benchmark is less useful than your own trend. The more informative number is the split between working time and waiting time within your cycle, since waiting is the addressable portion and typically the larger one.
Q7. Can intake KPIs be gamed?
Yes, and each in a predictable way. Completeness improves if you reduce required fields. Cycle time improves if you exclude the difficult requests. Exception rate improves if exceptions get reclassified. Pairing each metric with an outcome it should move makes gaming visible, because a gamed leading metric stops predicting.
Q8. Should intake KPIs be separate from procure-to-pay KPIs?
Yes. Intake metrics describe what arrives at the front door and procure-to-pay metrics describe what happens to it afterward. Combining them conceals whether a problem originates in capture or in execution, which is precisely the distinction a scorecard exists to expose.