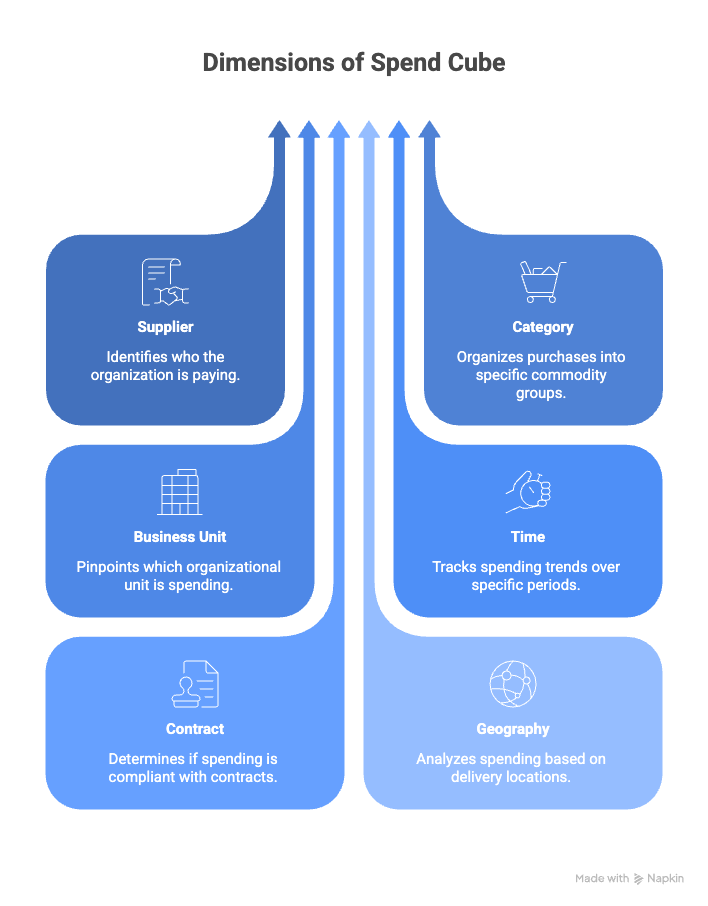
A spend cube is a multi-dimensional analytical model that organizes procurement spending data along three or more axes for analysis. The spend analysis cube typically presents spend by supplier, category, and business unit — though additional dimensions like geography, time period, or contract can be added. This structure enables procurement teams to slice and dice spend data, drilling down from enterprise totals to granular transaction details to identify patterns, opportunities, and anomalies.
Read more: The Role of Spend Analysis Solutions in Modern Procurement
Why Spend Cube Matters in Procurement
Spend visibility is the foundation of strategic procurement. Without understanding what is being purchased, from whom, and by which parts of the organization, procurement cannot identify savings opportunities, consolidation candidates, or compliance gaps. The spend cube provides this visibility in an actionable format. By analyzing spend across multiple dimensions simultaneously, procurement leaders can answer questions that flat reports cannot — such as which suppliers serve multiple categories, which business units drive spending with specific vendors, or how category spend varies by region.
The Core Process of Spend Cube
The process begins with data extraction. Spend data is pulled from accounts payable, purchasing systems, procurement cards, and other sources, capturing organizational expenditures.
Data is cleansed and normalized. Supplier names are standardized, duplicates merged, and missing information enriched. This step is critical — dirty data produces misleading analysis.
Spend is classified into categories. Using commodity codes, machine learning, or manual review, each transaction is assigned to a spend category taxonomy that enables meaningful aggregation.
The cube is constructed by organizing cleansed, classified data along defined dimensions. Users can then navigate the cube — pivoting, filtering, and drilling to explore spending patterns and answer analytical questions.
Core Components of Spend Cube
- Dimensions: The axes of analysis — typically supplier, category, and business unit — along which spend is organized.
- Measures: The quantitative values being analyzed, primarily spend amount but potentially also transaction count, PO count, or invoice count.
- Hierarchies: Levels within each dimension enabling drill-down, such as category to subcategory to commodity, or business unit to department to cost center.
- Time Periods: Temporal dimension allowing comparison across months, quarters, or years to identify trends.
- Filters: Selection criteria to focus analysis on specific subsets of spend.
Key Benefits of Spend Cube
- Provides comprehensive visibility into where organizational money is going across all analytical dimensions.
- Identifies consolidation opportunities by revealing fragmented spend distributed across multiple suppliers or categories.
- Supports category management by showing spend patterns, supplier concentrations, and business unit demands for each category.
- Enables benchmarking by comparing spend across regions, divisions, time periods, or against industry standards.
- Reveals compliance gaps by highlighting off-contract, maverick, or non-preferred supplier spending.
- Informs negotiation strategy by demonstrating total spend leverage with suppliers across all business units and categories.
Common Pitfalls of Spend Cube
- Dirty data: Garbage in, garbage out. Invest in data cleansing before building the cube.
- Poor categorization: Miscategorized spend produces misleading analysis. Validate classification accuracy.
- Static analysis: A spend cube built once and never refreshed becomes stale. Update regularly.
- Analysis paralysis: Endless slicing without action wastes the insight. Use findings to drive sourcing decisions.
KPIs of Spend Cube
| Dimension | Sample KPIs |
| Data Quality | Spend visibility percentage, categorization accuracy, supplier match rate |
| Consolidation | Suppliers per category, spend concentration, fragmentation index |
| Compliance | On-contract spend percentage, preferred supplier adoption, maverick spend rate |
| Coverage | Addressable spend percentage, spend under management, sourced spend rate |
Key Terms in Spend Cube
- Spend Cube: A multi-dimensional analytical model organizing spend data for slicing and drilling.
- Spend Analysis: The process of collecting, cleansing, classifying, and analyzing procurement spending data.
- Dimension: An axis of analysis in the cube, such as supplier, category, or business unit.
- Drill-Down: Navigating from summary to detail levels within a dimension hierarchy.
- Addressable Spend: Spend that procurement can influence through sourcing and supplier management activities.
- Spend Visibility: The percentage of total spend that is captured, cleansed, and classified in the analysis.
Technology Enablement
Modern Source-to-Pay platforms include spend analytics modules that automate data extraction from multiple sources, cleansing of supplier and category data, and classification using machine learning. These tools build and refresh spend cubes continuously, providing procurement teams with always-current visibility into spending patterns across all dimensions and enabling data-driven category management decisions.
FAQs
Q1. What is a spend cube?
A multi-dimensional model organizing procurement spend data by supplier, category, business unit, and other dimensions for analysis.
Q2. What are the typical dimensions in a spend cube?
Supplier, category, and business unit are core. Time, geography, and contract status are common additions.
Q3. How is a spend cube different from a spend report?
A cube is interactive and multi-dimensional. Users can pivot, filter, and drill. Reports are static, predefined views.
Q4. What data sources feed a spend cube?
Accounts payable, purchasing systems, procurement cards, expense systems, and any other source of organizational spending.
Q5. How often should the spend cube be refreshed?
Monthly is common for operational use. Quarterly may suffice for strategic category planning.
Q6. What is spend visibility?
The percentage of total organizational spend that is captured, cleansed, and classified in the spend cube.
References
For further insights into these processes, explore Zycus’ dedicated resources related to Spend Cube: