


In today’s fast-paced business environment, efficient inventory management is crucial for success. A key tool for achieving this is ABC analysis, a popular inventory optimization technique that prioritizes inventory items based on their value and importance. This guide delves deep into ABC analysis, explaining its core concepts, implementation steps, advantages, limitations, and best practices.
TL;DR
- ABC analysis is an inventory management technique that classifies items into A (high value), B (medium value), and C (low value) based on annual consumption value.
- It helps businesses prioritize resources on high-value items, improve inventory control, reduce costs, and enhance cash flow.
- Implementation involves data gathering, calculating item contributions, ranking, and applying control measures based on item categories.
- While effective, challenges like data accuracy and demand fluctuations require regular reviews and technology support.
- Zycus’ AI-driven Source-to-Pay solutions and inventory management tools automate ABC analysis, providing actionable insights and improving supply chain efficiency.
What is ABC Analysis?
ABC analysis classifies inventory items into three categories: A, B, and C, based on their annual consumption value. Here’s a breakdown of these categories:
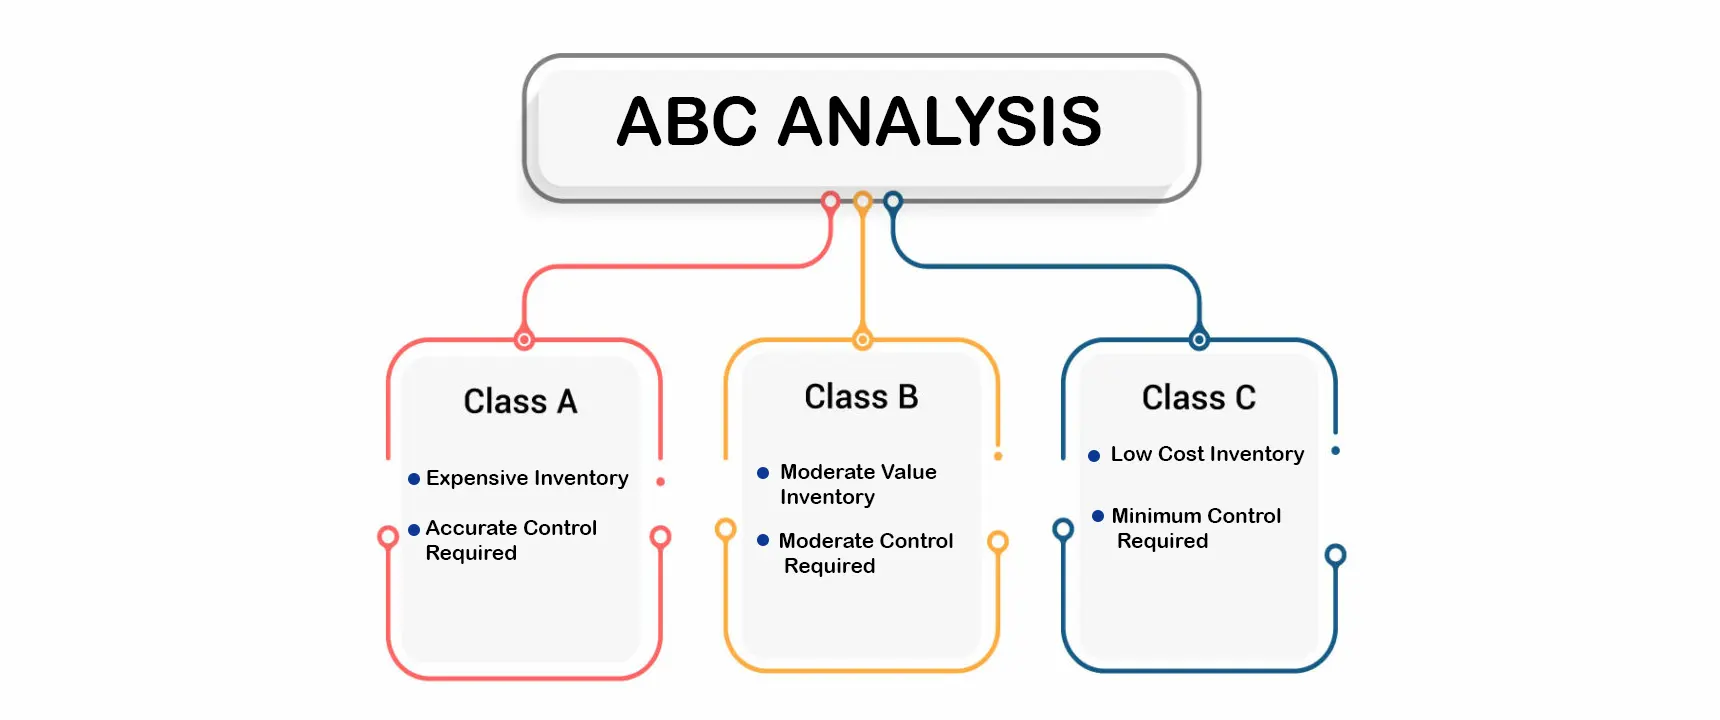
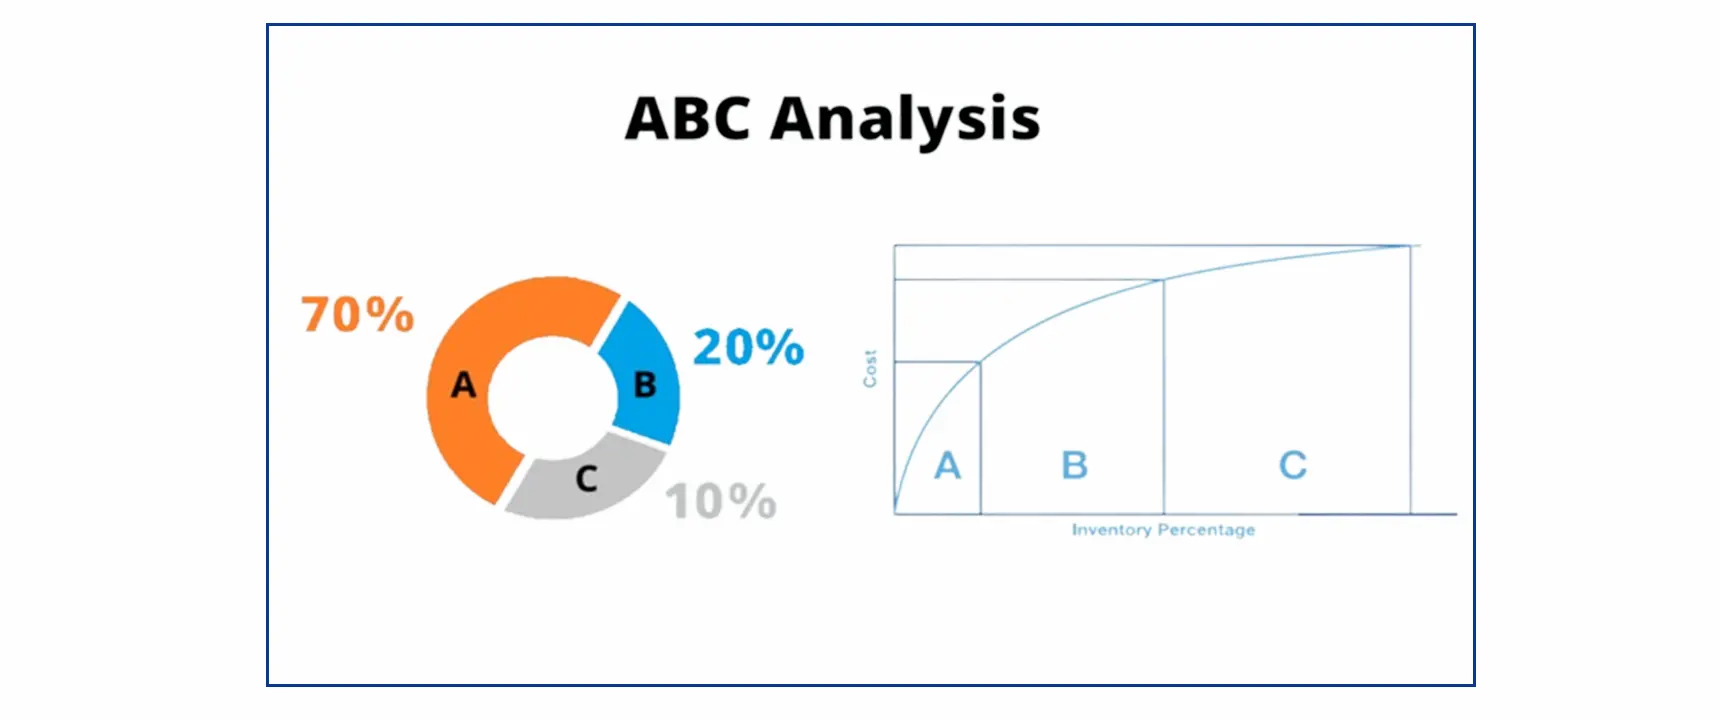
- A Items (High Value): Typically the most expensive and crucial items, accounting for a significant portion (around 80%) of the total inventory value despite representing a smaller percentage (around 20%) of the total number of items.
- B Items (Medium Value): Important items with moderate value and demand, falling between A and C items in terms of both percentage of total value (around 15%) and number of items (around 30%).
- C Items (Low Value): Least valuable items with low demand and low cost, constituting a large portion (around 70%) of the total number of items but contributing a minimal portion (around 5%) of the total inventory value.
Benefits of ABC Analysis
- Improved Inventory Control: By focusing on A items, businesses can ensure proper management and adequate stock levels, minimizing stockouts and maximizing customer satisfaction.
- Cost Reduction: Reduced focus on managing and stocking less important C items helps save resources and minimize carrying costs.
- Enhanced Cash Flow: ABC analysis helps eliminate excess inventory, reducing the risk of stockouts and improving cash flow through faster inventory turnover.
- Better Decision Making: Understanding which items are more valuable empowers businesses to make informed decisions about stocking, reordering, and resource allocation.
How to Implement ABC Analysis?
Here’s a step-by-step guide to implementing ABC analysis in your inventory management system:
- Data Gathering: Collect historical data on sales, inventory levels, and costs for each item in your inventory. This data will be the foundation for your analysis.
- Calculate ABC Coefficients: Divide the annual sales value of each item by the total annual sales value of all items. This will provide a percentage representing each item’s contribution to the overall inventory value.
- Classify Items: Rank the items in descending order based on their ABC coefficients. The top 20% (approximately) become A items, the next 30% (approximately) become B items, and the remaining 50% (approximately) become C items. Remember, these percentages can vary depending on your specific data and business needs.
- Implement Control Measures: Establish different control measures for each category. A items might require stricter control with frequent monitoring and accurate records. B items can have less stringent controls with regular monitoring, while C items might require minimal controls and record-keeping.
Challenges of ABC Analysis
While a valuable tool, ABC analysis comes with certain limitations:
- Data Accuracy: The effectiveness of ABC analysis hinges on the accuracy of historical data used for calculations. Inaccurate data can lead to misclassification of items.
- Demand Fluctuations: ABC analysis assumes somewhat stable demand patterns. However, seasonal trends, promotions, or new product launches can cause demand fluctuations, potentially affecting item classifications.
- Lead Times: Items with long lead times might be classified as A items even if they have lower demand, as delays can disrupt production or sales.
Read more: 7 Step Approach to Sustain Business During Supply Chain Disruptions
Best Practices for ABC Analysis
- Regular Review: Revisit your ABC classifications periodically to account for changes in demand, sales patterns, and new product introductions.
- Simple Classifications: Maintain straightforward classification methods for A, B, and C items to ensure ease of implementation and understanding for your team.
- Software Utilization: Utilize inventory management software to automate data collection, analysis, and reporting, streamlining the ABC analysis process.
- Labor Allocation: Allocate labor resources based on item classification. A items might require more time and effort for management compared to C items.
Beyond ABC Analysis: Alternative Inventory Management Techniques
While ABC analysis is a popular technique, there are situations where other methods might be more suitable. Here are some alternatives to consider:
- VED Analysis (Vital, Essential, Desirable): Similar to ABC analysis, VED prioritizes inventory based on criticality. “Vital” items are essential for production, “Essential” items are important but have alternatives, and “Desirable” items are convenient but not critical.
- XYZ Analysis: This method classifies inventory based on demand variability. “X” items exhibit high demand fluctuations, “Y” items have moderate fluctuations, and “Z” items have relatively stable demand. XYZ analysis helps tailor forecasting and safety stock levels for different demand patterns.
- SDE Analysis (Service Level, Demand Variability, Lead Time): This multifaceted approach considers three key factors: desired service level for an item, its demand variability, and lead time for procurement. SDE provides a more comprehensive view for optimizing inventory management strategies.
- Inventory Turnover Analysis: This method evaluates inventory efficiency by calculating how often inventory is sold and replaced within a specific period. High turnover rates indicate efficient inventory management, while low rates suggest potential overstocking or obsolescence.
- Lean Manufacturing Principles: This philosophy focuses on eliminating waste in all aspects of production, including inventory management. Lean principles advocate for minimal inventory levels and just-in-time (JIT) manufacturing to reduce carrying costs and improve responsiveness to demand changes.
Achieving Excellence: The Hackett Group’s Story with Zycus Generative AI
Witness The Hackett Group’s journey toward achieving excellence in procurement. This video highlights their strategic use of Zycus Generative AI to overcome obstacles and set new benchmarks in the industry.See Their Journey – Click to Watch!
Who is Responsible for ABC Analysis?
There isn’t a single, specific role responsible for ABC analysis in every company. The ownership can vary depending on the company structure and size. Here are some possibilities:
- Inventory Manager: In many organizations, the inventory manager or a team under their supervision would be responsible for conducting ABC analysis. They typically have direct oversight of inventory data and possess the inventory management expertise to perform the analysis and implement its findings.
- Purchasing Manager: For companies where purchasing plays a significant role in inventory management, the purchasing manager or their team might be responsible for ABC analysis. They have procurement expertise and understanding of supplier lead times, which are important considerations in inventory classification.
- Supply Chain Analyst: In larger companies with dedicated supply chain departments, a supply chain analyst might be tasked with conducting ABC analysis. Their broader understanding of supply chain dynamics can contribute to a more holistic inventory management strategy.
- Cross-functional Team: Sometimes, ABC analysis might be a collaborative effort involving personnel from inventory management, purchasing, and potentially even finance or engineering. This approach can leverage diverse perspectives and expertise to create a more comprehensive inventory classification system.
ABC Analysis for Direct Spend vs. Indirect Spend
ABC analysis is typically done for direct spend items, not indirect spend items. Here’s why:
Focus of ABC Analysis:
-
- ABC analysis prioritizes inventory items based on their annual consumption value. It aims to identify high-value items (A items) that require tighter controls and better management due to their significant impact on overall inventory costs.
Direct vs. Indirect Spend:
-
- Direct spend items are directly related to the production of goods or services. These are the raw materials, components, or subassemblies that become part of the final product you sell. They directly contribute to the cost of goods sold (COGS).
- Indirect spend items, on the other hand, are not directly involved in production but are necessary for the overall functioning of the business. Examples include office supplies, utilities, rent, and marketing expenses.
Why ABC Focuses on Direct Spend:
- Direct spend items typically have a higher value compared to indirect spend items. They represent a larger portion of the total inventory cost and can significantly impact profitability.
- Managing direct spend items directly affects production efficiency and product quality.
- The number of direct spend items is usually lower compared to indirect spend items, making them more manageable for focused analysis with ABC.
Indirect Spend Management:
While ABC analysis isn’t typically used for indirect spend, there are alternative methods for optimizing indirect costs:
- Spend Cube Analysis: This method classifies indirect spend based on spend category, supplier, and location, enabling targeted cost reduction strategies.
Read more: A Step-by-Step Guide to Mastering the Indirect Procurement Process - Vendor Consolidation: Reducing the number of vendors for specific indirect spend categories can streamline procurement processes and potentially lead to better pricing.
- Negotiation and Sourcing Strategies: Implementing effective negotiation tactics and exploring alternative sourcing options can help reduce costs for indirect spend items.
Download White paper: 10 Key Measures to Manage Indirect Spend
Frequency of ABC Analysis
The ideal frequency for conducting ABC analysis can vary depending on several factors specific to your business. Here’s a breakdown of the key considerations:
- Inventory Dynamics: If your business deals with products with high demand fluctuations, frequent stock changes, or new product introductions, you might need more frequent ABC analysis (e.g., quarterly) to ensure classifications remain accurate and reflect current inventory realities.
- Industry Standards: Certain industries might have established best practices for ABC analysis frequency. Researching these benchmarks can provide valuable guidance for your company.
- Company Size and Complexity: Larger companies with vast and complex inventories might benefit from more frequent analysis (e .g., biannually) compared to smaller businesses with a more stable inventory profile.
- Resource Availability: The time and resources required to conduct ABC analysis need to be factored in. If resources are limited, a yearly analysis might be sufficient, with provisions for adjustments based on critical situations.
General Recommendations:
- Minimum Recommendation: At the very least, it’s advisable to perform ABC analysis at least once a year. This ensures your inventory classifications remain relevant and continue to reflect current business conditions.
- Ideal Scenario: For many businesses, a biannual analysis (every six months) is a good balance. This allows for adjustments to account for seasonal trends or other changes without placing an undue burden on resources.
- Continuous Monitoring: Beyond scheduled analyses, it’s crucial to have a system for monitoring critical inventory data (e.g., sales figures, stock levels) and be prepared to conduct an ad-hoc ABC analysis if significant changes arise.
- Additional Tips:
1. Establish a Review Schedule: Set a clear schedule for reviewing your ABC classifications, considering the factors mentioned above.
2. Data Accuracy Emphasis: Always prioritize the accuracy and completeness of your inventory data to ensure reliable ABC analysis results.
3. Flexibility is Key: Be prepared to adapt your ABC analysis frequency based on your specific business needs and market dynamics.
By considering these factors and recommendations, you can determine the optimal frequency for conducting ABC analysis in your company, ensuring it remains a valuable tool for optimizing your inventory management strategy.
Case study example: ABC Analysis for a Processed Food Manufacturing Company
Scenario:
A processed food manufacturing company with ketchup, instant noodles, and confectionery lines across 6 US factories. Some items are imported (cocoa) and others sourced locally.
ABC Analysis Implementation:
Data Collection:
- Gather historical data on annual usage and cost for each raw material across all factories and product lines.
- Include data for both imported and locally sourced items.
Calculation:
- Calculate the annual consumption value for each item by multiplying its annual usage by its unit cost.
- Divide each item’s annual consumption value by the total annual consumption value of all items to get a percentage contribution.
- Rank all items by their percentage contribution in descending order.
Classification:
Define category thresholds based on the Pareto principle (80/20 rule). A common split is:
- Category A (High Value): Top 20% of items by contribution (typically high-cost ingredients or those critical to production)
- Category B (Medium Value): Next 30% of items (moderately priced or important ingredients)
- Category C (Low Value): Bottom 50% of items (low-cost, readily available ingredients)
Example:
| Item | Annual Usage | Unit Cost | Annual Consumption Value | Contribution % | Category (Preliminary) |
| Cocoa (Imported) | 100,000 kg | $5/kg | $500,000 | 10% | A |
| Flour (Local) | 2,000,000 kg | $1/kg | $2,000,000 | 40% | A |
| Sugar (Local) | 1,500,000 kg | $0.8/kg | $1,200,000 | 24% | A |
| Vegetable Oil (Local) | 800,000 L | $1.5/L | $1,200,000 | 24% | A |
Considering Locations and Imports:
-
- While the national analysis provides a high-level view, consider further analysis by factory and product line to identify location-specific optimization opportunities.
- For imported items like cocoa, factor in additional costs like import duties and transportation when calculating the annual consumption value.
- Analyze historical import data to assess potential risks and develop alternative sourcing strategies if necessary.
Strategies and Tactics by Category:
a) Category A (High Value):
-
- Strategy: Tight control and cost optimization.
- Tactics:
- Negotiate long-term contracts with reliable suppliers for volume discounts and secure supply.
- Implement minimum order quantities to optimize deliveries and reduce transportation costs.
- Explore alternative sourcing options for imported items to mitigate risks and potentially reduce costs.
- Conduct regular price and quality checks with suppliers.
b) Category B (Medium Value):
-
- Strategy: Balance cost control with operational efficiency.
- Tactics:
- Implement periodic price and supplier evaluations.
- Maintain a balance between order quantities and storage costs to avoid overstocking or stockouts.
- Consider implementing vendor-managed inventory (VMI) for some B items, allowing suppliers to manage inventory levels at your facilities.
c) Category C (Low Value):
-
- Strategy: Streamline processes and minimize management effort.
- Tactics:
- Implement automated ordering systems for C items with predictable demand patterns.
- Negotiate blanket purchase agreements with suppliers for C items to secure favorable pricing.
- Consider consolidating similar C items from different vendors to simplify procurement processes.
Benefits of ABC Analysis for Processed Food Manufacturers:
- Reduced Inventory Costs: By focusing on managing high-value A items more effectively, processed food manufacturers can save on carrying costs, minimize waste, and optimize overall inventory investment.
- Improved Supply Chain Efficiency: ABC analysis helps identify potential supply chain risks associated with critical A items, allowing manufacturers to develop strategies for mitigating disruptions and ensuring consistent production.
- Enhanced Negotiation Power: Knowing which ingredients contribute most to overall costs empowers manufacturers to negotiate better pricing with suppliers, especially for high-value A items.
- Data-Driven Decision Making: ABC analysis provides valuable data insights for optimizing procurement processes, managing supplier relationships, and allocating resources effectively.
Technology and Software in ABC Analysis
Inventory management software plays a crucial role in streamlining and simplifying ABC analysis. Here’s how technology aids in this process:
- Data Automation: Manual data collection for ABC analysis can be tedious and error-prone. Inventory management software automates data collection from various sources like point-of-sale (POS) systems, warehouse management systems (WMS), and enterprise resource planning (ERP) systems. This ensures data accuracy and eliminates manual data entry errors.
- Efficient Calculations: Software automates the complex calculations involved in ABC analysis, such as calculating annual consumption value and assigning category classifications. This saves time and minimizes the risk of calculation errors.
- Data Visualization Tools: Inventory management software provides data visualization tools like charts and graphs to represent ABC classifications visually. This allows for easier data interpretation and quicker identification of high-value (A) items.
- Scenario Modeling: Some software offers scenario modeling capabilities. You can simulate the impact of different inventory control strategies on specific items or categories, aiding in data-driven decision making for optimizing inventory management.
- Alerts and Notifications: Software can be configured to set alerts and notifications based on pre-defined parameters. This can be helpful for monitoring critical A items and triggering actions when stock levels fall below reorder points.
Explore Zycus’ Source to Pay Software
The Role of AI in ABC Analysis
Artificial intelligence (AI) has the potential to further enhance ABC analysis by:
- Advanced Data Analysis: AI algorithms can analyze vast amounts of historical sales data, identify patterns, and predict future demand fluctuations. This can lead to more accurate classifications and improved forecasting, especially for items with seasonal demand variations.
- Machine Learning: Machine learning algorithms can learn from historical data and suggest optimal inventory control strategies for different item categories. This can help businesses move beyond basic ABC classifications and implement more nuanced inventory management approaches.
- Exception Handling: AI can identify anomalies in data patterns, potentially uncovering hidden trends or unexpected demand changes. This can help businesses proactively address potential stockouts or overstocking situations.
However, it’s important to remember that AI in ABC analysis is still evolving. While it offers promising capabilities, human expertise remains crucial for interpreting data, setting appropriate control measures, and making final decisions based on business context.
Data Inputs for ABC Analysis
Here’s a breakdown of the data inputs required for ABC analysis and their typical sources:
- Item Data: This includes a unique identifier for each item in your inventory (e.g., SKU code, product name). Data source: Inventory management system, ERP system.
- Historical Sales Data: This includes historical sales volume and revenue data for each item over a specific period (e.g., past year). Data source: Point-of-sale system, ERP system, sales reports.
- Unit Cost Data: This includes the cost per unit of each item, including purchase price and any additional costs like transportation or import duties. Data source: Purchase orders, supplier invoices, accounting system.
By integrating these data points from various sources, inventory management software can calculate the annual consumption value for each item and facilitate the ABC classification process.
Conclusion
ABC analysis is a powerful tool for processed food manufacturers to gain valuable insights into their inventory costs and optimize inventory management strategies. By classifying items based on their annual consumption value, manufacturers can prioritize control efforts, improve sourcing strategies, and ultimately contribute to a more efficient and cost-effective supply chain. Remember, the effectiveness of ABC analysis hinges on the accuracy and completeness of your data. Regularly review your classifications and adapt your strategies as your business and market dynamics evolve.
FAQs
Q1. What is ABC analysis in inventory management?
ABC analysis is a method of classifying inventory items into three categories—A, B, and C—based on their annual consumption value. It helps businesses prioritize management efforts on high-value items.
Q2. How are A, B, and C items defined in ABC analysis?
- A Items: High-value items (~20% of stock, ~80% of value).
- B Items: Medium-value items (~30% of stock, ~15% of value).
- C Items: Low-value items (~50% of stock, ~5% of value).
Q3. What are the main benefits of using ABC analysis?
ABC analysis improves inventory control, reduces carrying costs, enhances cash flow, and helps businesses make informed decisions about stocking and reordering.
Q4. How often should ABC analysis be performed?
The frequency depends on business needs, but most companies conduct ABC analysis annually or biannually. Businesses with volatile demand may benefit from quarterly reviews.
Q5. What challenges are associated with ABC analysis?
Common challenges include data accuracy, demand fluctuations, and lead time variability, which can affect item classification.
Q6. Can ABC analysis be used for indirect spend?
ABC analysis is primarily used for direct spend items, but other methods like Spend Cube Analysis are better suited for managing indirect spend.
Q7. How does technology support ABC analysis?
Inventory management software automates data collection, classification, and reporting. AI tools enhance accuracy, predict demand changes, and provide actionable insights.
Q8. Who is responsible for conducting ABC analysis?
Depending on the organization, it could be inventory managers, supply chain analysts, or cross-functional teams including procurement and finance.
Q9. What are some alternatives to ABC analysis?
Alternatives include VED Analysis, XYZ Analysis, SDE Analysis, and Lean Inventory Management, which focus on criticality, demand variability, and efficiency.
Q10. How can Zycus help with ABC analysis?
Zycus offers AI-powered Source-to-Pay solutions that automate ABC analysis, improve spend visibility, and enable smarter inventory and supplier management.
Related Reads:
- Unlocking Efficiency: The Pros and Cons of Supplier Managed Inventory
- Building Success Through a Solid Supplier Management Framework
- Solution – Supplier Network
- 11 Successful Tips for Winning Supplier Negotiation
- Leveraging Generative AI to Unlock New Procurement Frontiers
- Your Guide to Supplier Network
- 7 Step Approach to Sustain Business During Supply Chain Disruptions
- VUCA approach towards Supply Chain
- A 5-Step Process to Effective Supplier Management
- Supplier Management–Benefits, Process, & Best Practices
- Why Maintaining Supplier Relationship Management is Important?
- White Paper: The Why, What And How Of Supplier Management
- Research Report: Seven Keys to Better Sourcing and Supplier Management
- Taking a 360° Approach to Supplier Management