A network optimization model is a mathematical framework used to design, evaluate, and improve supply chain networks by determining the optimal configuration of facilities, transportation routes, and inventory positioning. It analyzes variables such as facility locations, capacities, demand patterns, and logistics costs to identify the network structure that best balances cost, service levels, and risk across the end-to-end supply chain.
Why it Matters in Procurement?
While supply chain network optimization sits within the logistics and operations domain, its outputs directly influence procurement strategy. The location of manufacturing plants, warehouses, and distribution centers determines which suppliers are viable based on lead times, freight costs, and regional availability. Procurement teams that understand network constraints can make better sourcing decisions, negotiate location-appropriate terms, and align supplier selection with the organization’s physical supply chain footprint. Ignoring network design leads to suboptimal supplier choices, inflated logistics costs, and service level failures.
The Core Process and Lifecycle of the Network Optimization Model
The process begins with data collection. Organizations gather information on current facility locations, supplier locations, customer demand by geography, transportation costs, warehouse capacities, and service level requirements. This data forms the foundation for any supply chain network optimization exercise.
Next, the model is configured with objectives and constraints. Common objectives include minimizing total landed cost, maximizing service coverage, or balancing cost against delivery speed. Constraints may include capacity limits, minimum service levels, regulatory requirements, or capital investment thresholds.
The optimization engine then runs scenarios to evaluate different network configurations. It tests variables such as opening or closing facilities, shifting volumes between nodes, consolidating warehouses, or adding regional distribution points. Each scenario produces cost, service, and risk outputs for comparison.
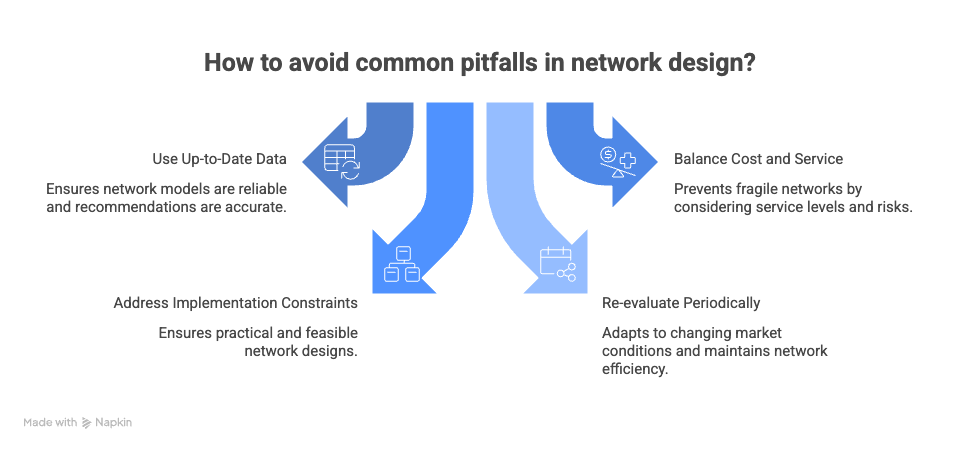
After analysis, the recommended network design is validated against real-world feasibility — considering factors like labor availability, infrastructure, local regulations, and implementation complexity. The final design informs long-term decisions on facility investment, supplier footprint, and logistics strategy.
Core Components of Network Optimization Model
- Facility Location Analysis: Determines the optimal number, location, and function of manufacturing plants, warehouses, and distribution centers based on demand, cost, and service trade-offs.
- Transportation Modeling: Evaluates freight lanes, carrier options, and routing strategies to minimize logistics costs while meeting delivery requirements.
- Demand Allocation: Assigns customer demand to specific facilities based on proximity, capacity, and cost — ensuring each node serves the right geography.
- Capacity and Inventory Planning: Balances throughput capacity and safety stock levels across the network to avoid bottlenecks and stockouts.
- Scenario Simulation: Runs what-if analyses to test network resilience under different demand patterns, cost fluctuations, or disruption scenarios.
- Total Cost Modeling: Calculates end-to-end landed cost including production, warehousing, transportation, duties, and inventory carrying costs for each network option.
Key Benefits of Network Optimization Model
Reduces total supply chain cost by identifying the optimal balance between facility, transportation, and inventory expenses.
Improves service levels by positioning inventory closer to demand and reducing delivery lead times.
Informs strategic sourcing by aligning supplier selection with network realities — lead times, freight costs, and regional capacity.
Enhances resilience by modeling disruption scenarios and identifying network vulnerabilities before they become operational failures.
Supports capital planning by quantifying the cost-benefit trade-offs of facility investments, closures, or consolidations.
Data Inputs Required for Network Modeling
- Demand data by geography: Historical and forecasted customer demand by region and product to drive allocation decisions.
- Facility cost structures: Fixed and variable costs for each facility, including labor, rent, and overhead.
- Transportation lane rates: Freight costs by mode and origin-destination pair to model logistics expenses.
- Service level requirements: Delivery time expectations by customer segment that constrain inventory positioning.
- Supplier location data: Geographic coordinates and lead times for key suppliers affecting inbound logistics.
- Capacity constraints: Throughput limits and storage capacity for each network node.
KPIs of Network Optimization Model
| Dimension | Sample KPIs |
| Cost | Total landed cost, logistics cost as a percentage of revenue, cost per unit shipped |
| Service | Order-to-delivery lead time, on-time delivery rate, geographic coverage percentage |
| Efficiency | Facility utilization rate, transportation lane efficiency, and inventory days of supply |
| Risk | Single-source node exposure, network disruption recovery time |
Key Terms in Network Optimization Model
- Landed Cost: The total cost of a product delivered to its destination, including production, freight, duties, taxes, and handling.
- Distribution Center: A facility used to receive, store, and redistribute goods to customers or retail locations.
- Node: A point in the supply chain network, such as a factory, warehouse, supplier site, or customer location.
- Lead Time: The elapsed time between order placement and delivery, influenced by production, transit, and handling durations.
- Scenario Analysis: A technique that models different assumptions or conditions to evaluate how the network performs under varying circumstances.
- Greenfield Analysis: A network design approach that starts from scratch, unconstrained by existing facilities, to identify the theoretically optimal configuration.
- Service Level: A measure of delivery performance, often expressed as the percentage of orders delivered on time or within a defined window.
FAQs
Q1. What is a network optimization model?
A mathematical framework that determines the optimal configuration of facilities, transportation routes, and inventory to balance cost, service, and risk.
Q2. How does network optimization relate to procurement?
Network design determines which suppliers are viable based on lead times and freight costs, directly influencing sourcing strategy.
Q3. What data is needed for network optimization?
Facility locations and costs, customer demand by geography, transportation rates, service level requirements, and capacity constraints.
Q4. How often should a network be re-optimized?
Every 3–5 years, or when significant changes occur such as new markets, acquisitions, or major demand shifts.
Q5. What is the difference between greenfield and brownfield analysis?
Greenfield designs from scratch without constraints. Brownfield optimizes within the reality of existing facilities.
Q6. Can network optimization reduce procurement costs?
Yes, indirectly. Aligning supplier selection with network constraints avoids inflated freight costs and lead time mismatches.
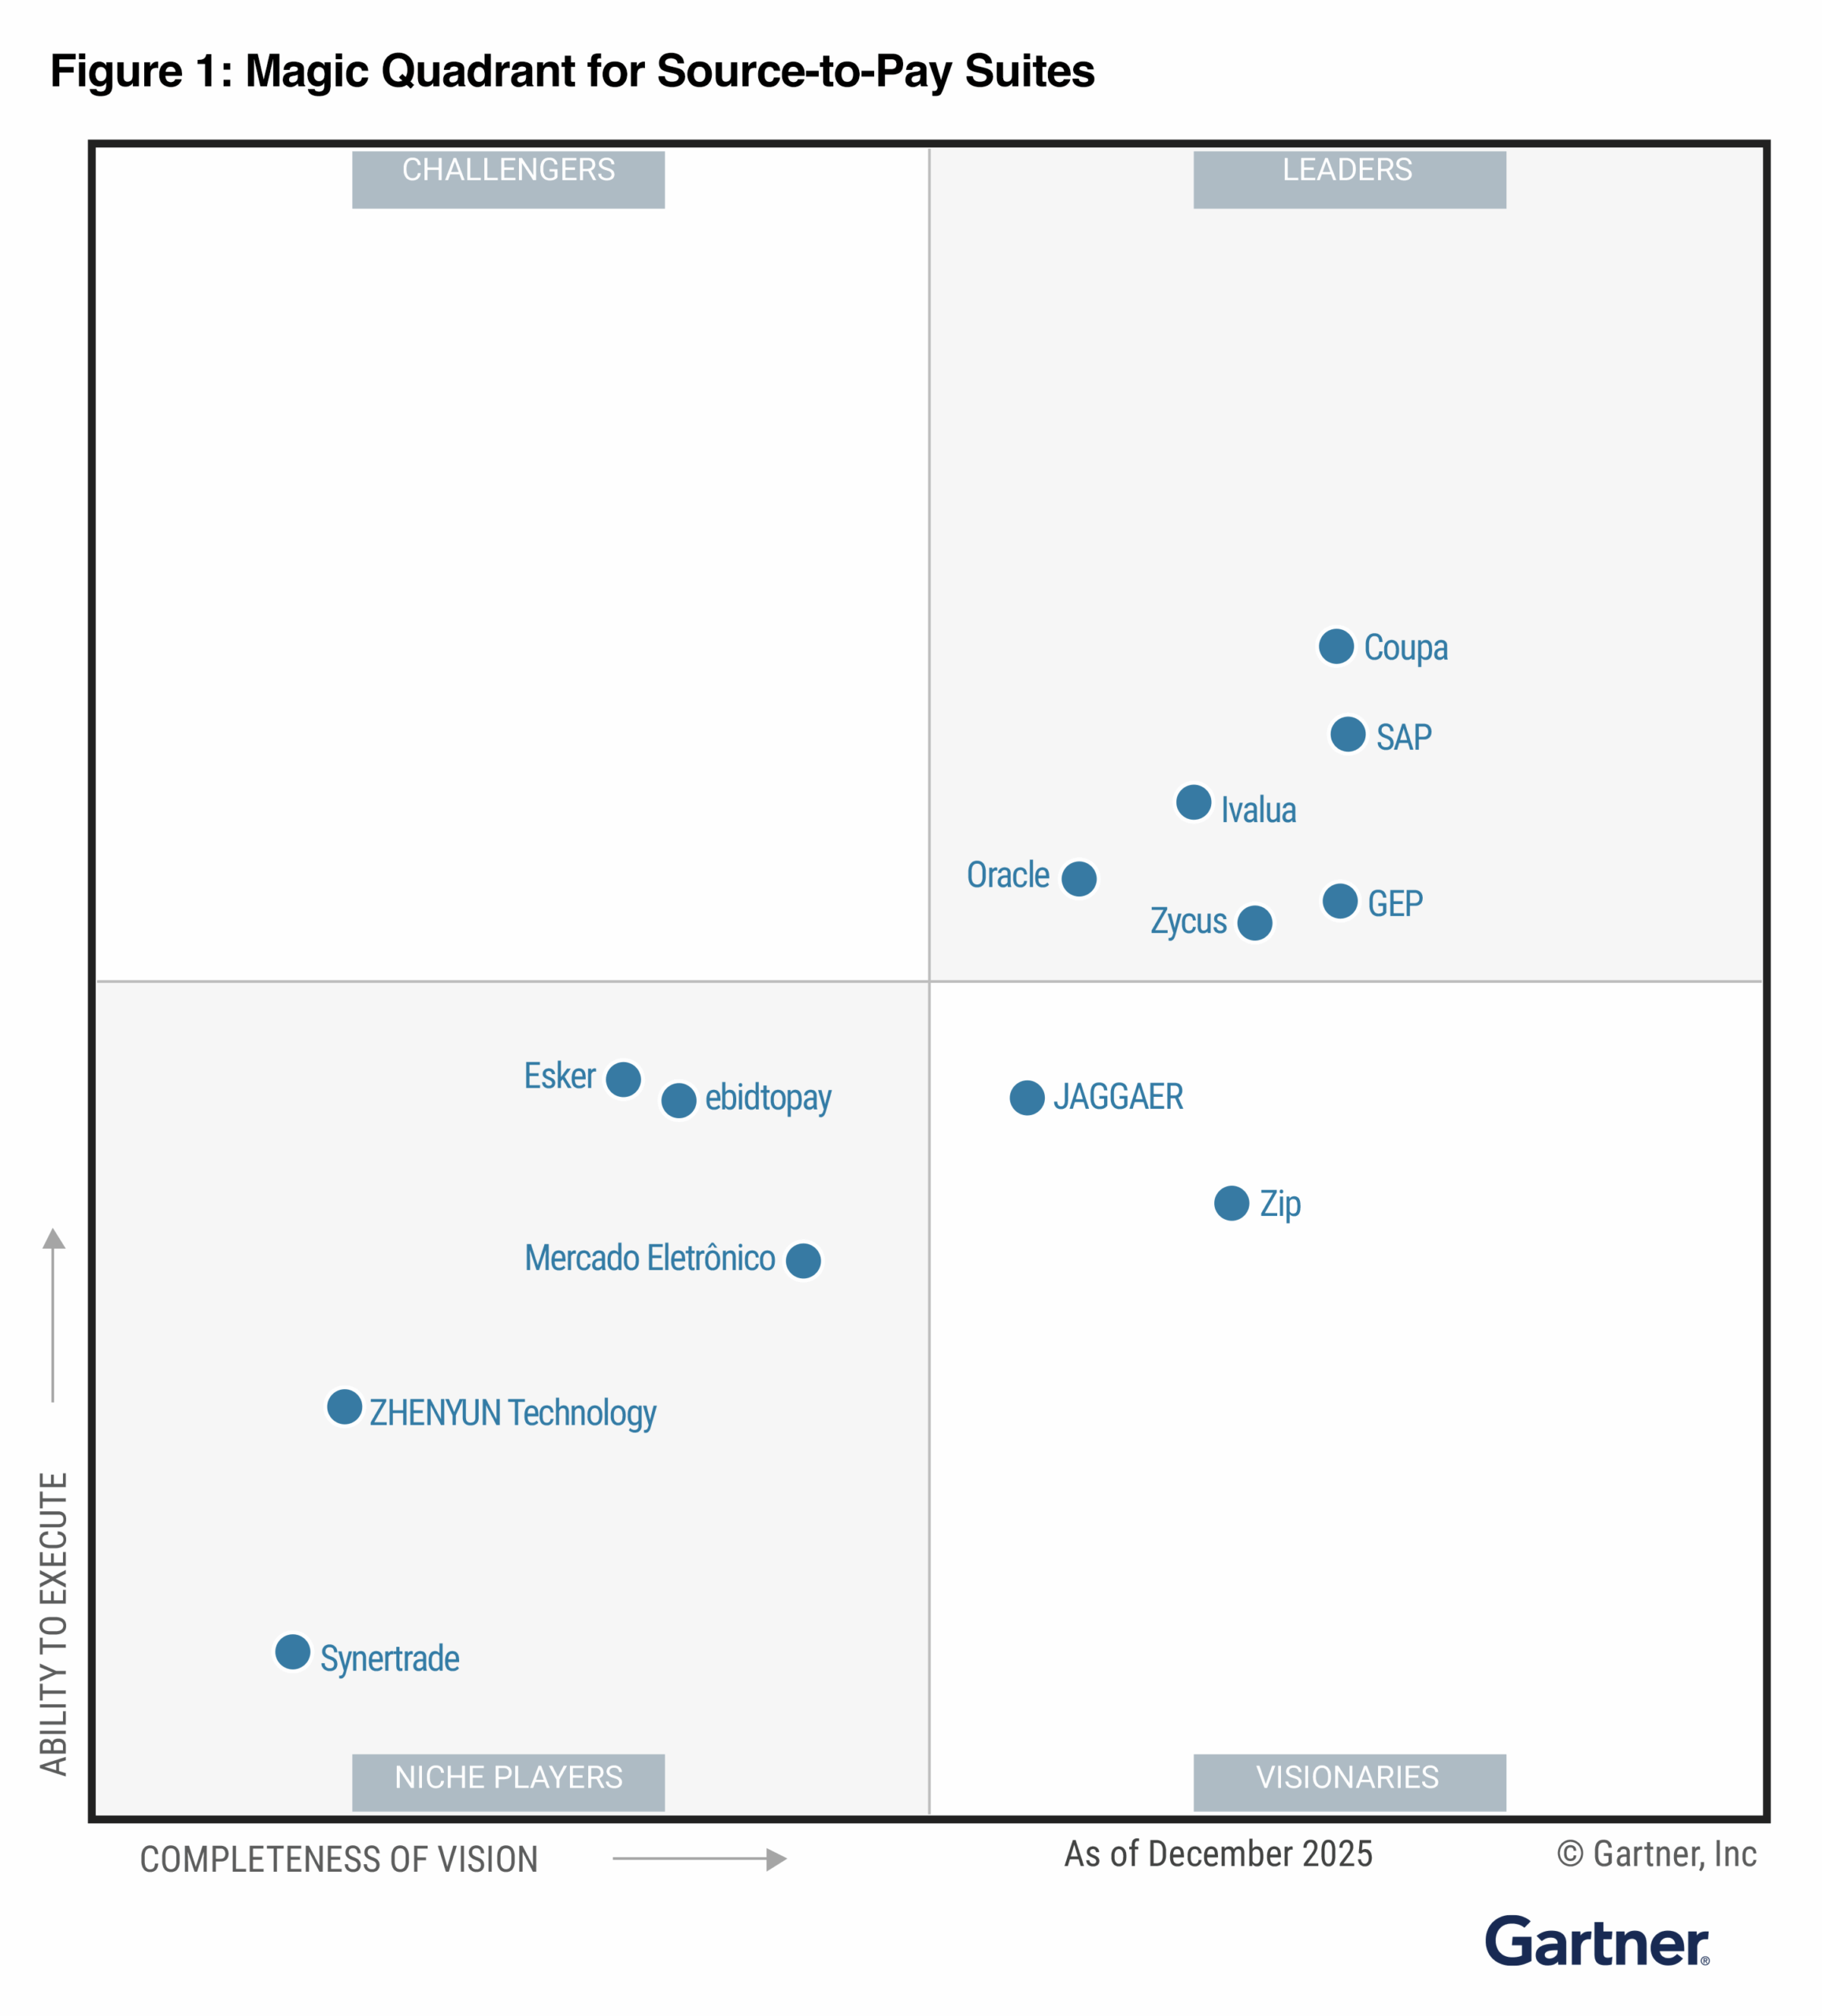
Q7. What tools are used for network optimization?
Specialized supply chain planning platforms such as Coupa (Llamasoft), Kinaxis, Blue Yonder, and o9 Solutions.
References
For further insights into these processes, explore Zycus’ dedicated resources related to the Network Optimization Model:
- Spend Analysis Mistakes that can mar your Sourcing Strategy
- 3 Steps to Reducing Spend Through Procurement – BFSI perspective
- P2P Transformation: Procure-to-Pay Trends for 2024 & Beyond
- Redefining the role of modern procurement in 2022
- Zycus Pulse of Procurement 2018: Your Annual Check-Up on the Prognosis for Procurement