


Key procurement and supply chain metrics are the defined measurements procurement uses to track performance, demonstrate value, and inform decisions across the source-to-pay process and the supply chain it serves. The right metric set turns activity into evidence, making procurement’s contribution visible to finance and the executive team while giving the procurement function itself the signal it needs to manage day-to-day operations. The wrong metric set — too many, too narrow, or measuring the wrong things — produces dashboards that consume attention without changing behaviour.
Why It Matters in Procurement
Procurement has historically been measured on savings, and savings alone is no longer enough. Executives increasingly ask procurement to demonstrate value across cost, risk, resilience, supplier performance, and process efficiency — and to do so with measurements that connect to outcomes the rest of the business recognises. A well-designed metric set serves three audiences: the executive team needs a small number of outcome metrics, the procurement leadership team needs management-level operational metrics, and the day-to-day team needs activity-level signals. Designing the metric set is itself a strategic decision — what gets measured shapes what gets done.
The Core Process of Key Procurement & Supply Chain Metrics
- Audience Identification. The process begins by identifying who the metric set serves — executive, procurement leadership, category teams, operational AP. Each audience requires different metrics at different cadences.
- Outcome-to-Metric Translation. Each audience has the outcomes it cares about. Translating those outcomes into measurable metrics — concrete enough to track, robust enough to defend — is the central design exercise.
- Baseline Establishment. Metrics without baselines are noise. The baseline is the starting reference against which performance is measured, established with enough rigour to support comparison.
- Target Setting. Each metric needs a target that distinguishes good from poor performance. Targets should be defensible, achievable with stretch, and aligned with the broader business goals the metric serves.
- Measurement and Reporting Cadence. Each metric is measured and reported at a cadence matched to its decision relevance — real-time for operational signals, monthly for management metrics, quarterly for executive metrics.
- Review and Adaptation. The metric set itself is reviewed periodically — metrics that no longer drive behaviour are retired, new outcomes the business cares about are added. Static metric sets age into irrelevance.
Core Components of Key Procurement & Supply Chain Metrics
- Metric definitions specify exactly what is being measured, how it is calculated, what data sources feed it, and any exclusions or normalisations. Without precise definitions, metrics drift into incomparability.
- Data foundation is the underlying source data — spend, contracts, supplier records, transactions — that metrics are calculated from. Metric reliability is bounded by data quality.
- Reporting layer translates metric values into formats audiences can interpret — dashboards, scorecards, briefings — calibrated to each audience’s information needs.
- Target framework documents the targets, their basis, and the review cycle for refresh — preventing targets from drifting into stale or unattainable.
- Action linkage connects metric movements to decisions and interventions. Metrics that do not influence action are administrative overhead.
Key Benefits of Key Procurement & Supply Chain Metrics
- Demonstrates procurement’s value contribution in language the executive team and finance recognise as legitimate.
- Provides the operational signal procurement leaders need to identify problems early and intervene before they escalate.
- Creates accountability across categories, suppliers, and processes by making performance visible and comparable.
- Supports continuous improvement by surfacing where procurement is weakest and where the next investment should focus.
Common Pitfalls of Key Procurement & Supply Chain Metrics
- Tracking too many metrics. A metric set with fifty KPIs is not measurement; it is information overload. Discipline lies in choosing the small number of metrics that actually drive decisions.
- Measuring activity rather than outcome. “Number of RFPs run” tells nobody whether procurement delivered value. Outcome-oriented metrics — savings realised, supplier performance, risk posture — are what audiences actually care about.
- Confusing metric movement with performance change. A metric can move because the underlying business is changing, not because procurement performed differently. Without context, metric movement can mislead.
- Failing to retire stale metrics. Metrics added when they mattered remain on dashboards long after the decisions they informed disappeared. Periodic retirement is part of metric set hygiene.
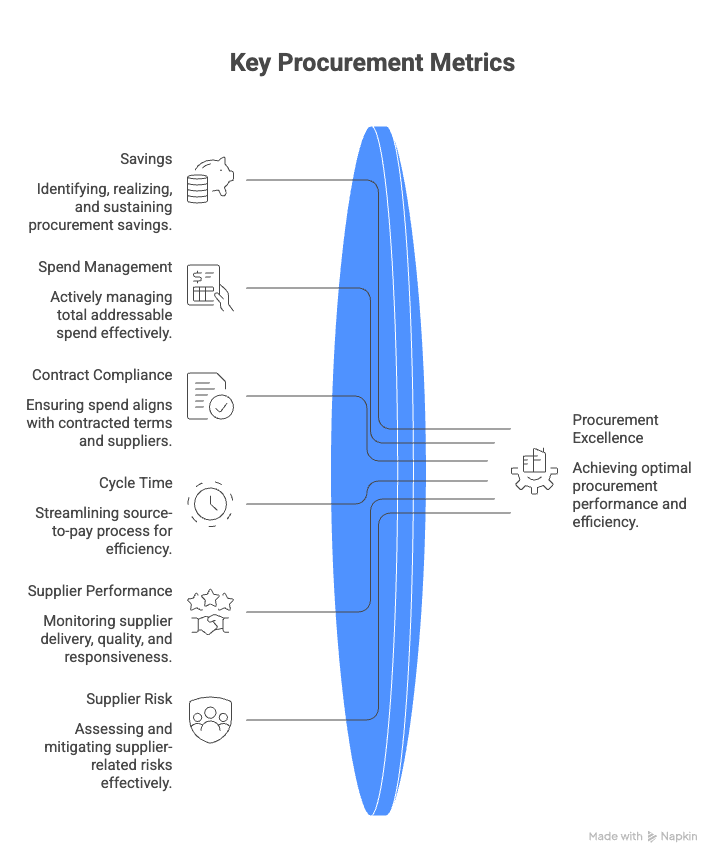
The Procurement Metrics That Most Functions Should Track
- Savings — identified, realised, sustained. The classic procurement metric, refined into three layers — savings identified in sourcing events, savings actually realised in invoiced spend, and savings sustained through subsequent periods. The three diverge more than executives often realise.
- Spend under management. The proportion of total addressable spend actively managed by procurement through contracts, preferred suppliers, and approved processes — a structural measure of procurement’s reach.
- Contract compliance. The proportion of spend made on contracted terms with contracted suppliers — the operational measure of whether sourcing decisions translate into purchasing reality.
- Cycle time across the source-to-pay process. Sourcing event duration, contract execution time, requisition-to-PO time, invoice-to-pay time — each a measure of process efficiency.
- Supplier performance. On-time delivery, quality conformance, responsiveness, SLA adherence — the operational health of the supplier base.
- Supplier risk posture. Concentration in critical categories, exposure to high-risk geographies, suppliers on watch — the resilience health of the supply base.
- Working capital impact. Days payable outstanding (DPO), early payment discount capture, supplier financing utilisation — procurement’s contribution to working capital efficiency.
- Maverick spend rate. The proportion of spend made off-policy or off-contract — a culture-and-process measure of how well procurement’s framework is actually followed.
- Cost avoidance vs. cost reduction. The distinction between savings on like-for-like spend and savings on growing or new spend — important for honest year-over-year comparison.
KPIs of Key Procurement & Supply Chain Metrics
| Dimension | Sample KPIs |
| Value Delivery | Savings realised vs. signed, spend under management %, contract compliance % |
| Process Efficiency | Sourcing cycle time, requisition-to-PO time, invoice-to-pay time |
| Supplier Health | On-time delivery %, supplier quality score, supplier risk concentration |
| Working Capital | Days payable outstanding, early payment discount capture rate |
Key Terms in Key Procurement & Supply Chain Metrics
- Savings Realisation: The proportion of savings identified in sourcing that actually appears in invoiced spend — typically much lower than the figure announced at award.
- Spend Under Management: The proportion of addressable spend actively governed through contracts, preferred suppliers, and procurement processes.
- Cycle Time: The elapsed time from process start to process completion — a primary efficiency metric across procurement sub-processes.
- Maverick Spend: Spend made outside procurement-approved channels, suppliers, or terms — a primary indicator of policy enforcement gaps.
- Cost Avoidance: Savings on spend that would otherwise have grown — distinct from cost reduction on like-for-like spend.
- Tail Spend: The long tail of low-value transactions and suppliers that often falls outside active procurement management.
Technology Enablement
Modern Source-to-Pay platforms generate the data foundation procurement metrics depend on — spend, contracts, suppliers, transactions — and provide the analytical layer that turns that data into reliable, real-time metric values. Platform-native reporting reduces the time procurement leaders spend constructing metrics and increases the time spent acting on what the metrics reveal.
FAQs
Q1. What are procurement and supply chain metrics?
The defined measurements procurement uses to track performance, demonstrate value, and inform decisions across the source-to-pay process and the supply chain it serves.
Q2. How many metrics should procurement track?
Fewer than instinct suggests. A small number of outcome metrics for the executive, a few dozen management metrics for procurement leadership, and operational signals at team level — but excessive total counts produce dashboard fatigue without driving action.
Q3. What is the difference between savings identified and savings realised?
Savings identified is the projected value at sourcing event award. Savings realised is the value actually appearing in invoiced spend. The two often diverge by 30% or more — making both worth tracking separately.
Q4. Why is contract compliance an important metric?
Because contracted savings are only captured if spend actually flows through the contracted supplier on contracted terms. Low compliance silently erodes the savings procurement reports to executives.
Q5. How often should the metric set be reviewed?
Annually at minimum. Metrics that no longer drive behaviour should be retired; outcomes the business newly cares about should be added. Static metric sets become irrelevant.
References
- Procurement Efficiency Metrics & AI: A Strategic Guide
- Procurement vs. Supply Chain: Key Differences and How They Work Together
- The Procurement Orchestration KPIs That Matter Most: Redefining Success
- Mastering Intake Management Metrics to Drive Procurement Efficiency
- eBook: The Impact of Direct Procurement Metrics on Business Performance