Spend Analysis is a systematic process for collecting, categorizing, and analyzing procurement expenditure data to uncover inefficiencies, cost-saving opportunities, and spending patterns. It provides insights into spending by supplier, category, and geography, helping organizations improve budgeting, streamline procurement processes, and achieve strategic financial goals.
Read more: Comprehensive Guide to Spend Analysis
Why Spend Analysis Matters
If finance asks, “Why did travel jump 18% last quarter?” you shouldn’t guess. Spend analysis turns scattered transactions into spend visibility: one view of suppliers, categories, and trends that everyone trusts.
How Spend Analysis Works
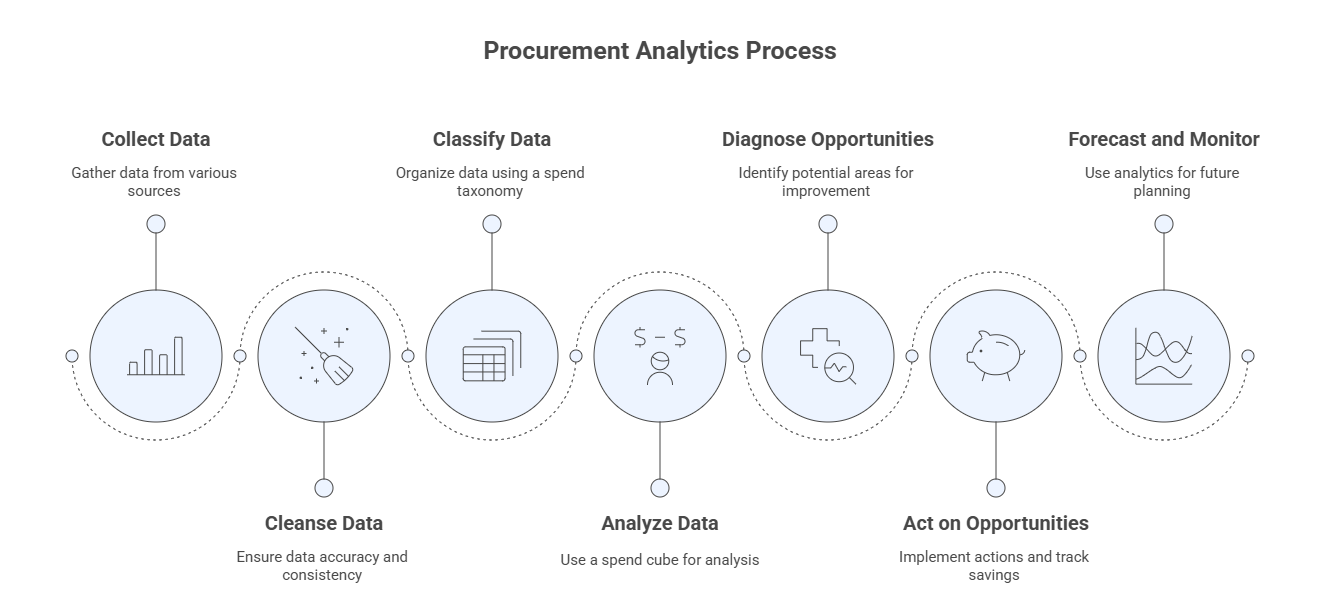
It starts with data—ERP exports, P2P logs, card feeds, invoices. You fix the messy bits (duplicate suppliers, odd units, fuzzy descriptions) and map each line to a business-friendly spend taxonomy.
With clean data, you can slice a spend cube analysis—supplier × category × time—to spot price variance, tail spend, or maverick buying. Layer procurement analytics on top to compare contracts with actuals, track savings realization, and build spend forecasting that informs budgets and cash planning.
Quick example: Marketing buys software from twelve resellers at nine different prices. After the cube view exposes the spread, you bundle volume with two vendors and lock terms. The variance disappears; the savings show up in the quarter, not just the slide deck.
Read more: How Automated Spend Analysis Revolutionizes Procurement Strategies
Key Facts About Spend Analysis
- Also called: procurement spend analysis, spend intelligence
- Used by: procurement, finance, supply chain, category managers
- Core goal: reliable spend visibility that turns into action
- Useful metrics: on-contract %, price variance, tail-spend %, supplier count by category, realized vs. planned savings
- Core capabilities: data cleansing, supplier normalization, spend taxonomy, spend cube analysis, spend forecasting, savings realization, procurement analytics
What Good Spend Analysis Looks Like
- Clean first. Names, units, and currencies line up; duplicates are merged.
- Taxonomy that fits the business. Not just an ERP code list.
- Always-on visibility. Dashboards refresh routinely; drill from totals to line items.
- Insights → projects. Findings turn into sourcing events, policy changes, and contracts—and you track savings realization to prove impact.
- Forecast-aware. Spend forecasting uses seasonality and pipeline demand, not wishful thinking.
Benefits of Spend Analysis
- Better negotiations because the numbers are undeniable.
- Lower risk by catching sole-source exposure and regional concentration.
- Lower total cost via supplier consolidation, catalog alignment, and tighter compliance.
- Fewer surprises as trends and exceptions surface early.
- Clearer conversations with stakeholders—“here’s what changed and why.”
A Practical 7-step Flow
Key Terms in Spend Analysis
- Spend visibility: a unified, drill-down view of spend.
- Spend cube analysis: multidimensional slicing to find patterns.
- Spend taxonomy: the category structure you classify to.
- Spend forecasting: predicting future spend from trends and pipeline.
- Savings realization: showing that identified savings hit the P&L.
- Procurement analytics: broader metrics around price, compliance, and cycle time.
How AI Enhances Spend Analysis
Let AI suggest classifications to your spend taxonomy, group supplier families, flag outliers, and summarize category insights. People still decide what to act on; software handles the grunt work.
FAQs
Q1. What is spend analysis in procurement?
It’s the process of cleaning, classifying, and examining purchasing data to create spend visibility and uncover savings, risk, and performance opportunities.
Q2. How does spend visibility improve negotiations?
It shows who you buy from, at what price, and in what quantities—so you can bundle volume, tackle price variance, and negotiate from facts.
Q3. What’s the difference between a spend cube and a spend taxonomy?
A spend taxonomy is the category model for classification. A spend cube analysis is how you slice the classified data across supplier, category, and time to reveal patterns.
Q4. Best practices for spend forecasting?
Use cleaned, categorized history; factor in seasonality and known pipeline; link to commodity indices where relevant; and reconcile forecasts against budget/actuals each cycle.
Q5. How do you ensure savings realization?
Define the savings type and baseline, implement controls (contracts, catalogs), and track realized vs. planned savings in your procurement analytics.
References
For further insights into these processes, explore Zycus’ dedicated resources related to Spend Analysis:
-
- This is What Happens When you Implement Spend Analysis
- Comprehensive Guide to Spend Analysis
- Spend Analysis Vs. Spend Management- Demystifying The Difference
- Analysis Report: Spend Analysis: Transforming Data into Value – Benchmark Report
- Smart Spend Analysis: A bird’s eye view
- Advanced Spend Analytics: A new offering for your procurement initiatives